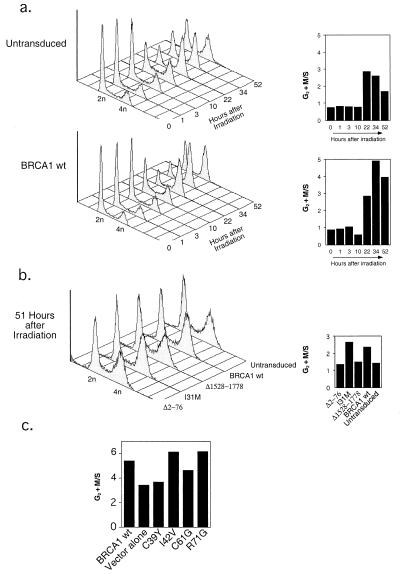
Figure 4.
Restoration of a G2 + M checkpoint in HCC1937 cells by BRCA1. (a) Cell-cycle profiles of untransduced and BRCA1 wt-reconstituted cells at various times after IR. Cells were irradiated with 4 Gy 2 days after plating and analyzed for cell-cycle distribution at the times indicated (hours after irradiation). The 2n and 4n DNA contents are shown. To better illustrate the progression of the BRCA1-reconstituted cells through G2 + M, we expressed the ratio of cells in G2 + M to cells in S phase (G2 + M/S) for each time point (Right). The difference in G2 + M progression between untransduced (or GFP- or vector alone-transduced) and BRCA1-reconstituted HCC1937 cells was obtained reproducibly in independent experiments. (b) To test the specificity of a G2 + M checkpoint restoration by BRCA1, we analyzed the cell-cycle profiles of HCC1937 cells reconstituted with wt BRCA1 or the I31M, Δ2–76, and Δ1528–1778 mutants at similar time points after IR, as in a. Shown are the cell-cycle profiles (Left) and the G2 + M/S ratios (Right) at 51 h after IR. (c) Ratios of G2 + M/S of HCC1937 cells reconstituted with wt BRCA1 or C39Y, C61G, I42V, and R71G mutants at 46 h after IR (as in a and b, cell-cycle progression of the cell cultures was analyzed at various time points after IR). Similar results were obtained in an independent experiment.

