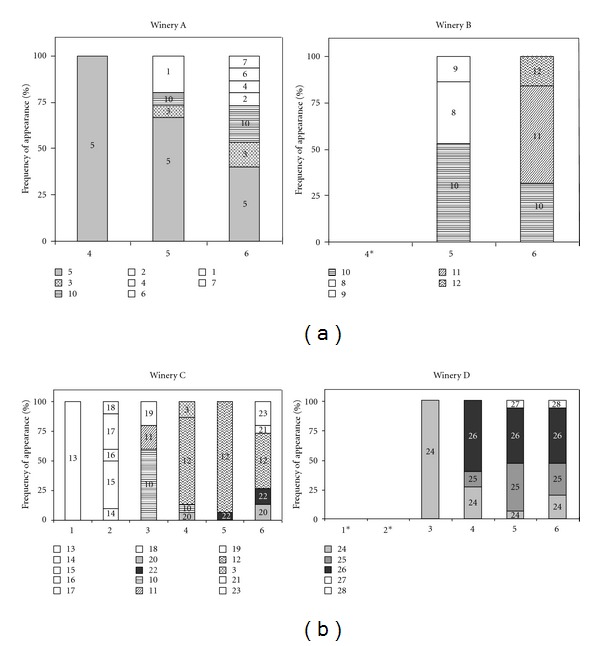
Figure 3.

Frequency of appearance (%) of O. oeni genotypes at each sampled stage (1: must; 2: tumultuous AF; 3: final AF; 4: initial MLF; 5: tumultuous MLF; 6: final MLF) in each winery. Empty bars mean genotypes that appeared once, filled bars mean genotypes that appeared in one winery, and textured bars were genotypes detected in more than one winery. *O. oeni was not detected.
