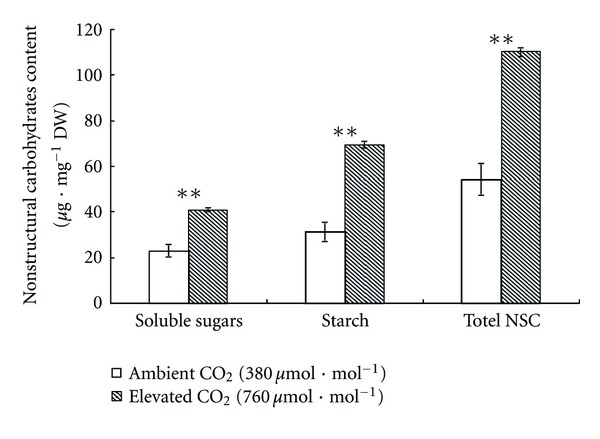
Figure 4.

Nonstructural carbohydrates content of Impatiens New Guinea grown under two CO2 concentration: ambient CO2 (380 μmol·mol−1) and elevated CO2 (760 μmol·mol−1). Asterisks show statistically significant differences (*P < 0.05; **P < 0.01; Student's t-test; n = 3 samples, with 5 plants per sample) and the bar is the standard deviation. Total NSC= soluble sugars + starch.
