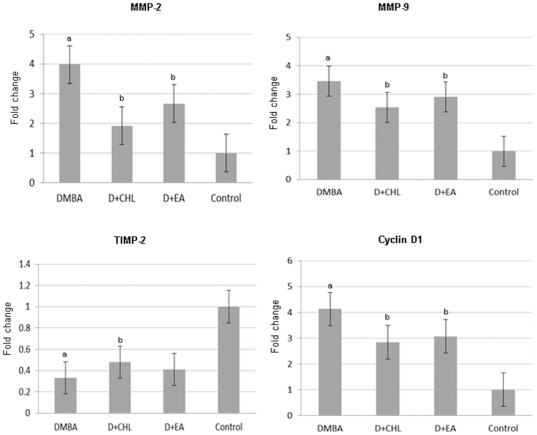
Figure 4. Relative mRNA expression levels of MMP-2, MMP-9, TIMP-2 and Cyclin D1 in various experimental groups as determined by RT-qPCR.
cDNA individually generated from the buccal pouch RNA of biological replicates was subjected to RT-qPCR analysis. Relative mRNA expression for each gene was determined and normalized to the average transcript expression of GAPDH internal control. The fold change in transcript expression for each gene was determined using the 2−ΔΔCt method. Data are the mean ± SD of two separate experiments. Statistical significance was determined by Mann-Whitney test (P<0.05). a Significantly different from control. b Significantly different from DMBA.

