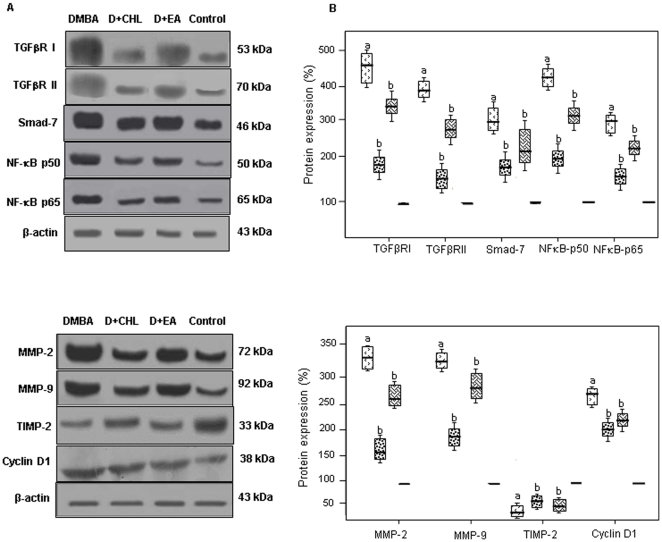
Figure 5. Western blot analysis of the differentially expressed genes.
(A) Representative immunoblots showing the protein levels of the differentially expressed genes in the buccal pouch total cell lysate. Protein samples (50 µg/lane) resolved on SDS-PAGE were probed with corresponding antibodies. Quantification was done by normalising the band density to that of β-actin. (B) Densitometric analysis. Each box plot represents the protein expression from control lysates for two determinations. a Significantly different from control by Mann-Whitney test (P<0.05). b Significantly different from DMBA.

