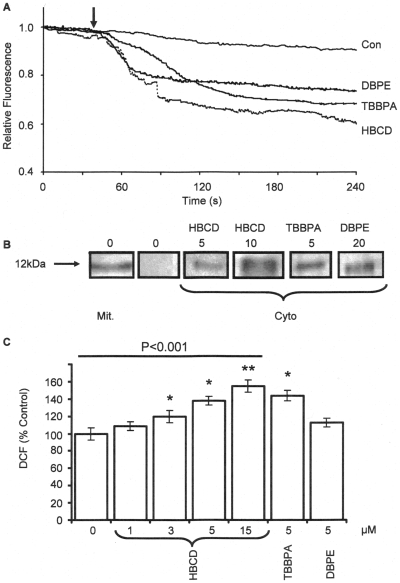
Figure 3. Effects of BFRs on mitochondrial depolarisation, cytochrome-c release and ROS generation in SH-SY5Y cells.
(A) Shows the effects of DBPE (10μM), TBBPA (10μM), and HBCD (10μM) on mitochondrial membrane depolarisation of SH-SY5Y cells loaded with rhodamine123. The traces are the averages of 10 individual cells, within the field-of-view and are typical of 3 replicate experiments. The arrow indicates the time point at which the BFRs were added to the cells. (B) Shows the effects of SH-SY5Y cells (5x10⁵) treated with HBCD (5, 10μM), TBBPA (5μM) and DBPE (20μM) for 12 hours. The cells were then homogenised and centrifuged to obtain the mitochondrial and cytosolic fractions. The fractions were the subjected to SDS-PAGE and immuno-stained with an anti-cytochrome c antibody. The blots were typical of two replicate experiments. (C) Shows the effects of HBCD (1 to15 μM), TBBPA (5μM) and DBPE (5μM) on ROS production as measured by the formation of dichlorofluorescein (DCF). The cells were treated with the chemicals for 24 hours and then incubated with DCFH-DA for 30 minutes before lysis with NaOH and measuring the DCF fluorescence. The data represents the mean±SD of 4 determinations (* and ** indicates the probability of the values being significant form control data of P≤0.05 and P≤0.01, respectively, using the student’s t-test). For multiple comparison data sets, ANOVA tests were performed (highlighted by the line) and the P values are given.

