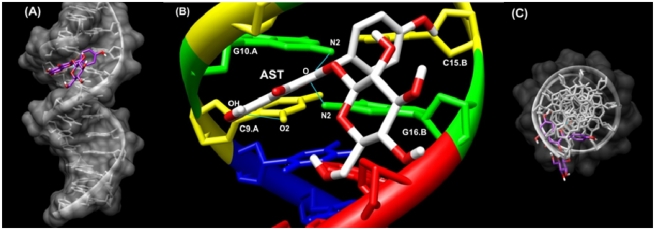
Figure 7.
Docking structure between d(CGCGAATTCGCG)2 (PDB ID:1D30) and AST. (A) Surface representation of d(CGCGAATTCGCG)2 complexes with AST (Display sideways); (B) Close up view of d(CGCGAATTCGCG)2 complexes with AST represented in the stick style. Hydrogen bonds between d(CGCGAATTCGCG)2 and AST were calculated by Chimera software and are drawn in blue lines; (C) Surface representation of d(CGCGAATTCGCG)2 complexes with AST (Display top).

