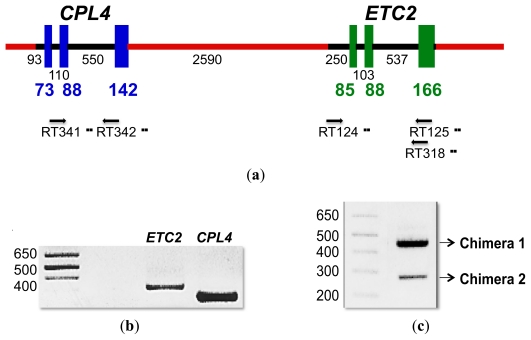
Figure 4.
Existence of CPL4-related chimeric transcripts. (a) Diagram illustrating the CPL4 and ETC2 genes located on Arabidopsis chromosome II. The blue boxes represent CPL4 exons. The green boxes represent ETC2 exons. The black lines represent introns and UTR. The red lines represent intergenic DNA. The lengths of DNA sequences are noted in base pairs. The positions of the PCR primers used in the RT-PCR are indicated with arrows; (b) Expression of ETC2 and CPL4 transcripts in Arabidopsis leaves. RNA was isolated from 12-day-old rosette leaves, and RT-PCR was performed to examine the expression of ETC2 and CPL4 transcripts. The size of the marker in base pairs is shown on the left; (c) Expression of ETC2 and CPL4 chimeric transcripts in Arabidopsis leaves. RNA was isolated from 12-day-old rosette leaves, and RT-PCR was used to examine the expression of chimeric transcripts. The size of the marker in base pairs is shown on the left.

