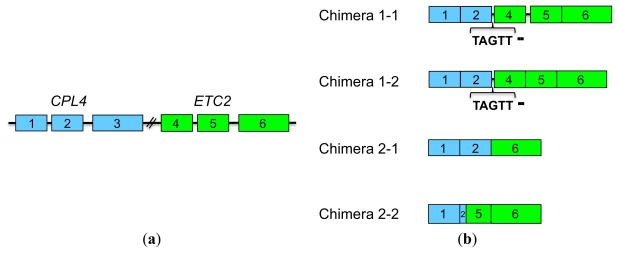
Figure 5.
Gene structure of CPL4-related chimeric transcripts. (a) Structure of CPL4 and ETC2 genes. The blue boxes 1, 2 and 3 represent CPL4 exons. The green boxes 4, 5 and 6 represent ETC2 exons. The black lines represent introns; (b) Structure of CPL4-related chimeric transcripts, Chimera 1-1, 1-2, 2-1 and 2-2, produced from CPL4 and ETC2 by intergenic alternative splicing. The blue boxes 1, 2 and 3 represent CPL4 exons. The green boxes 4, 5 and 6 represent ETC2 exons. The black lines represent introns. The linker sequences have been inserted between CPL4 and ETC2 in Chimera 1-1 and Chimera 1-2.

