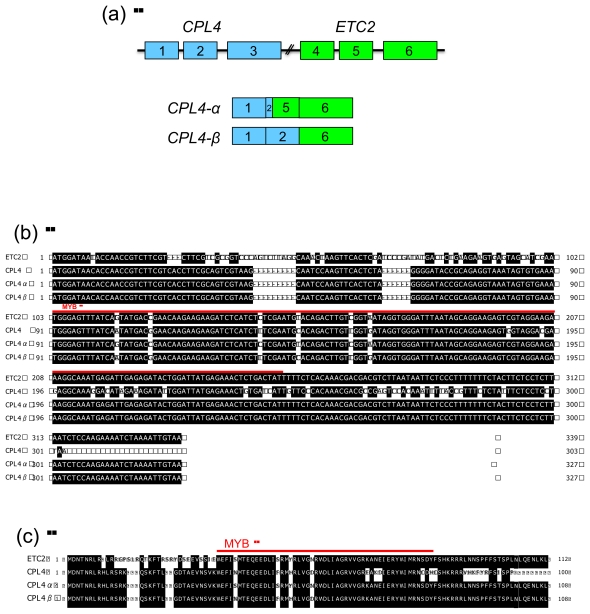
Figure 6.
Gene structure and amino acid sequences of CPL4-α and CPL4-β. (a) Structure of CPL4 and ETC2 genes. The blue boxes 1, 2 and 3 represent CPL4 exons. The green boxes 4, 5 and 6 represent ETC2 exons. The black lines represent introns; (b) cDNA sequence alignment of ETC2, CPL4, CPL4-α and CPL4-β transcripts. Identical nucleotides are shaded in black. The red line indicates the MYB region; (c) Amino acid sequence alignment of ETC2, CPL4 and deduced CPL4-α and CPL4-β proteins. Identical amino acids are shaded in black. The red line indicates the MYB region.

