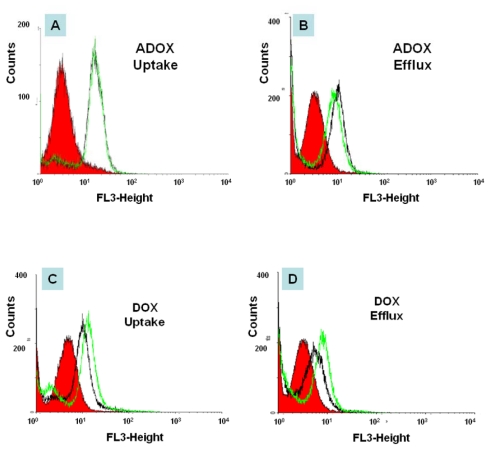
Figure 5.
Drug uptake and efflux of DOX and ADOX (2 μM) in drug-resistant leukemia cells (K562/DOX) in the presence (green line) or the absence (black line) of P-gp inhibitor (5 μM CsA) by FACS. Red filled area is control (cell without drug treatment). Black is cell with drug treatment, but without CsA. Green is cell with drug treatment, with CsA.

