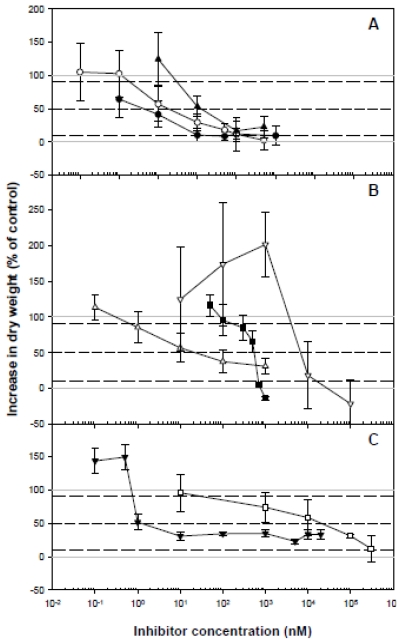
Figure 1.
Dose-response curves for several putative CBIs on bean calluses growth. Calluses growth was calculated as the percentage increase in dry weight relative to the untreated calluses after 30 d culture. A: (●) CGA 325′615, (▴) triazofenamide, (□) compound 1; B: (▵) oxaziclomefone, (■) dichlobenil, (▿) quinclorac; C: (○) flupoxam, (▾) AE F150944. Values are means ± SD of 8 measurements. Dotted lines were included in order to estimate I10, I50 and I90 values. Solid grey lines indicate the 100% and 0% of growth.

