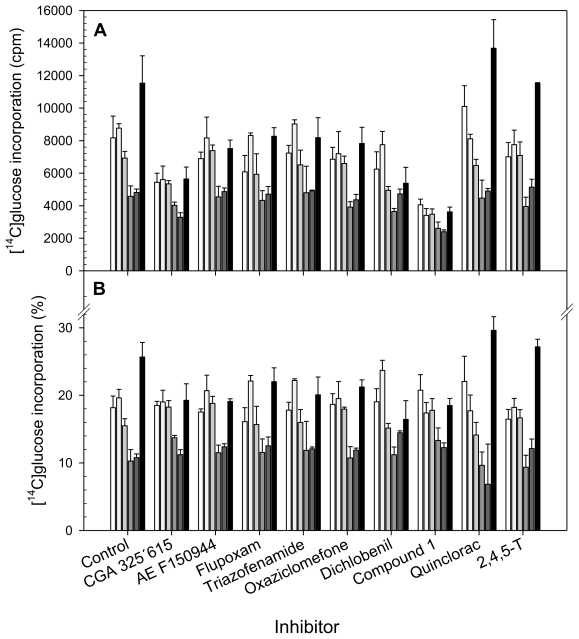
Figure 2.
[14C]Glc incorporation into cell wall fractions: CDTA (□), Carbonate (
 ), KOH (
 ), Sn-CR (
 ), ANW (
 ) and α-Cellulose (■) from cell suspensions untreated (Control) or treated for 20 h with different CBIs at their I50 concentration (see Table 2). Data are expressed as total cpm incorporated into each fraction (A) and as percentages of incorporation in each fraction regarding to total incorporation into the cell wall (B). Values are means ± SD of three technical replicates.

