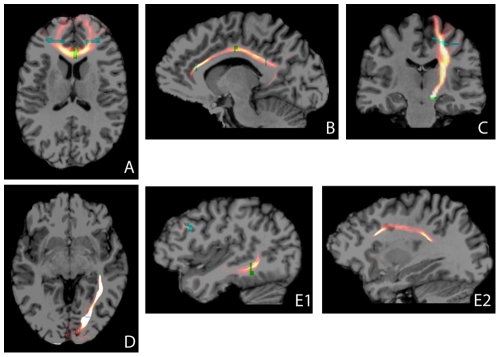
Figure 2. Tractography examples.
Tract density maps of a representative subject. Seed ROIs are given in green, target ROIs in blue. For each subfigure, the tract density windowing (yellow-red) is chosen such that subcortical projections can also be appreciated. The skull-stripped T1 underlay was registered to the diffusion space (b0-scan) using an affine transformation. A: genu of corpus callosum; B: cingulum; C: pyramidal tract; D: optic radiation; E1, E2: arcuate fasciculus (different sagittal slices).

