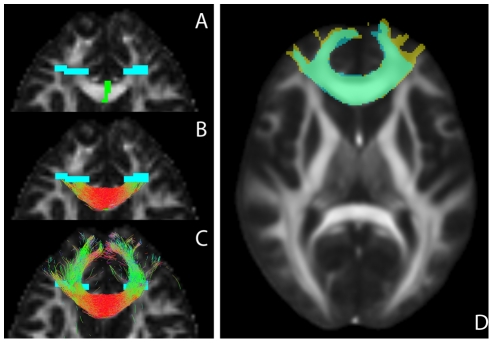
Figure 3. Proximal and extended tract segmentations and inter-session comparison.
A: ROIs for the genu of the corpus callosum overlaid on the FA map, seed ROI in green, target ROIs in blue; B: proximal tractogram; C: extended tractogram. D: tract segmentations of both scan sessions of the same subject, registered to the common FA space (underlay). Segmentation 1 in blue, 2 in yellow and segmentation overlap in green.

