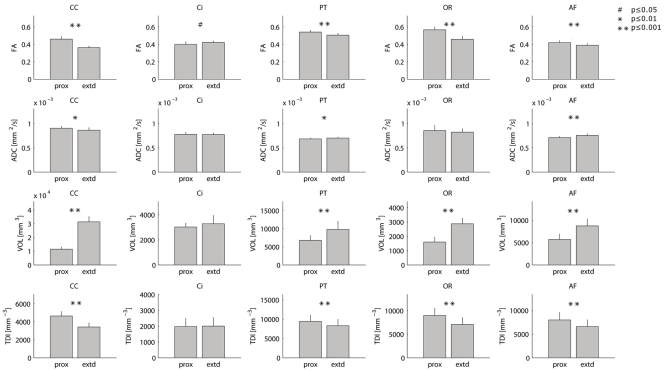
Figure 5. Reproducibility of tract metrics.
Tract metrics for both proximal (prox) and extended (extd) tract segmentations. The p-values are of paired t-tests for difference between proximal and extended values. FA: fractional anisotropy; ADC: apparent diffusion coefficient; VOL: tract volume; TDI: tract density. CC: genu of the corpus callosum; Ci: cingulum; PT: pyramidal tract; OR: optic radiation; AF: arcuate fasciculus.

