Figure 1.
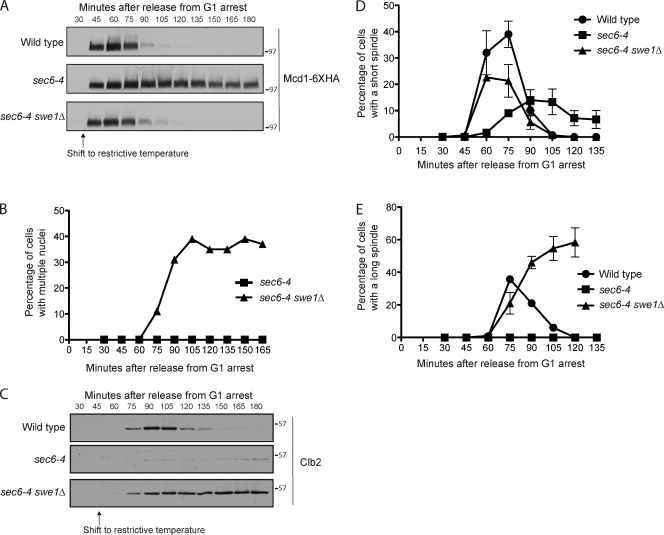
Blocking membrane traffic triggers a checkpoint arrest. (A) Cells were released from a G1 arrest and shifted to the restrictive temperature (34°C) at 30 min after release. Cleavage of Mcd1-6×HA was assayed by Western blotting. (B) Cells were released from a G1 arrest and shifted to the restrictive temperature (34°C) at 30 min after release. DNA staining was used to determine the percentage of cells with multiple nuclei. (C) Cells were released from a G1 arrest and shifted to the restrictive temperature (34°C) at 45 min after release. Levels of Clb2 were assayed by Western blotting. (D and E) Cells were released from a G1 arrest and shifted to the restrictive temperature (34°C) at 30 min after release. The percentage of cells with short or long spindles was determined. Error bars represent SEMs for three biological replicates. Numbers shown next to the Western blots indicate molecular mass in kilodaltons.

