Figure 3.
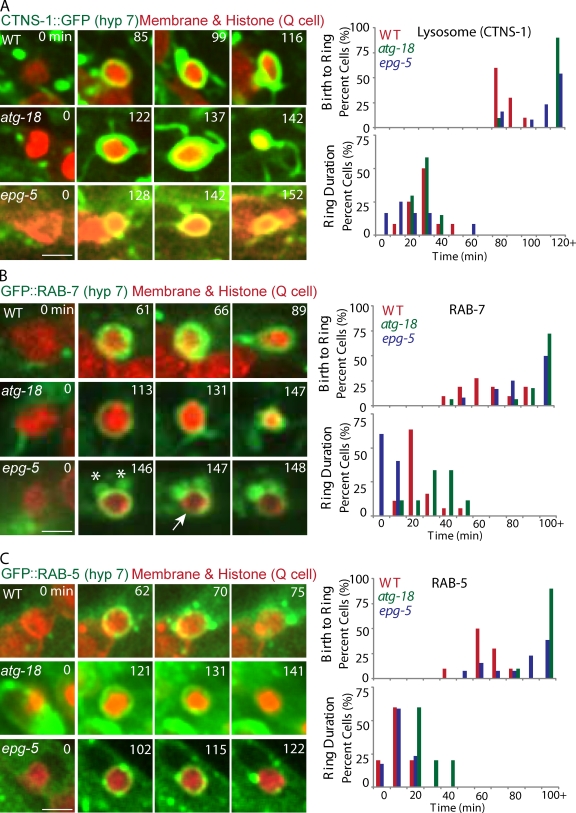
The recruitment and stability of lysosome, RAB-7, and RAB-5 onto Q cell corpse. (A–C) The left images are representative frames from time-lapse videos showing lysosome (labeled by CTNS-1::GFP; A), GFP::RAB-7 (B), and GFP::RAB-5 (C) recruitment and stability on the Q cell corpse in WT (top), atg-18 (middle), and epg-5 (bottom) mutants. The first column with time 0 shows the birth of apoptotic Q cells (mCherry), the second column shows the first frame of GFP signal on the Q cell corpse, and the right column shows the last frames of GFP signal on the Q cell corpse. The right top shows quantifications of the time interval from Q cell birth to the recruitment of lysosome, RAB-7, or RAB-5, and the bottom shows GFP signal duration time. n = 10–18 from a single experiment. Statistical analysis was shown in Fig. S2 (C–E). The asterisks show that the RAB-7 vesicles are associated with the Q cell corpse. The arrow shows the breakage of the RAB-7 ring on the Q cell corpse. Bars, 2.5 µm.

