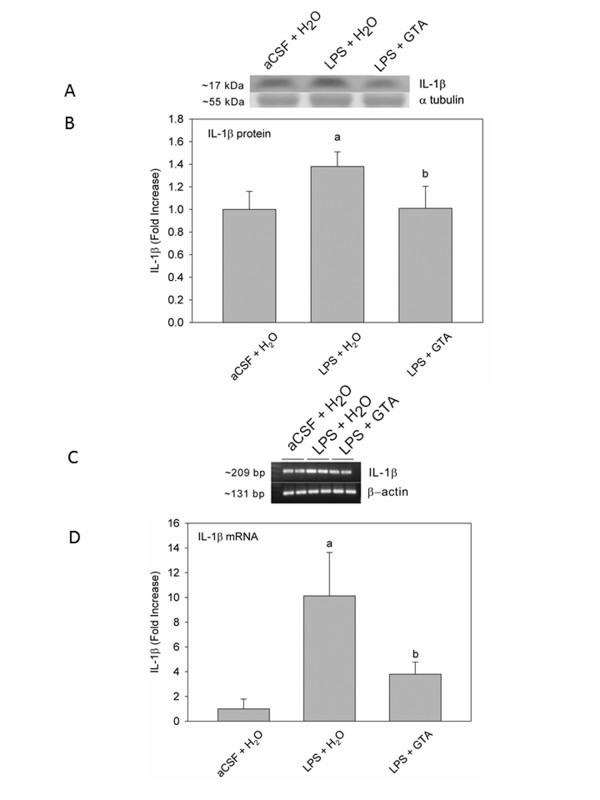
Figure 5.
The effect of long-term acetate supplementation on the expression of brain IL-1β in control rats (aCSF), rats subjected to neuroinflammation (LPS) and rats treated with either water (H2O) or glyceryl triacetate (GTA) as determined by Western blot analysis and quantitative real-time PCR. (A) Western blot representative images of bands for IL-1β and α-tubulin and (B) shows the means ± SD of the normalized optical density of IL-1β protein. (C) Representative images of the bands for IL-1β and β-actin cDNA and (D) shows the means ± SD of the normalized amplified IL-1β cDNA. Statistical significance (a = compared to aCSF + H2O, and b = compared to LPS + H2O) was set at P ≤ 0.05 (n = 6, per group), as determined by a one-way ANOVA followed by Tukey's post-hoc test.

