
Figure 1.
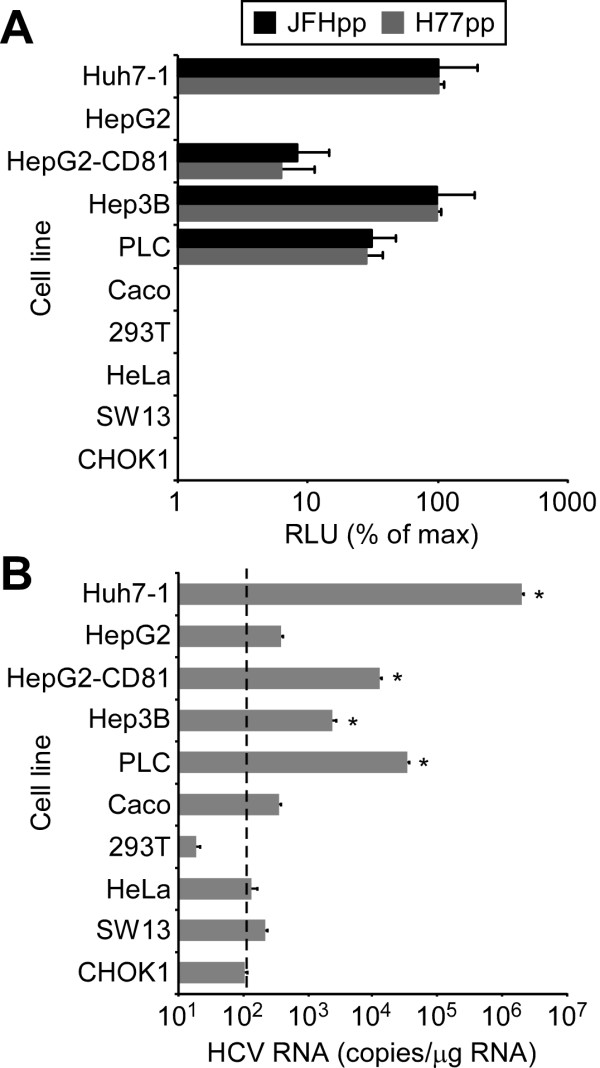
Permissiveness of cell lines for HCVpp and HCVcc infection. (A) Indicated cell lines were infected with equal amounts of JFHpp, H77pp or VSVGpp. HCVpp entry (relative light units (RLU) ± SD for triplicate samples determined 72 h p.i.) relative to Huh7-1 cells was calculated by subtracting cell line specific background and mock-control signals and then normalizing for cell line-specific VSVGpp entry levels. Results are graphed as a percentage of entry achieved in Huh7-1 infected cultures. (B) Indicated cell lines were infected with HCVcc at an MOI of 2.0 FFU/cell. Intracellular RNA was collected 72 h p.i. and HCV RNA was quantified by RTqPCR, normalized to GAPDH and is displayed as HCV RNA copies/μg total cellular RNA (means ± SD for triplicate samples). Significant increases in HCV RNA levels compared to CHO cells (one-way ANOVA and Tukey's post hoc t test) are denoted as * p value < 0.001. Dashed line represents background levels of non-specific bound HCV RNA.