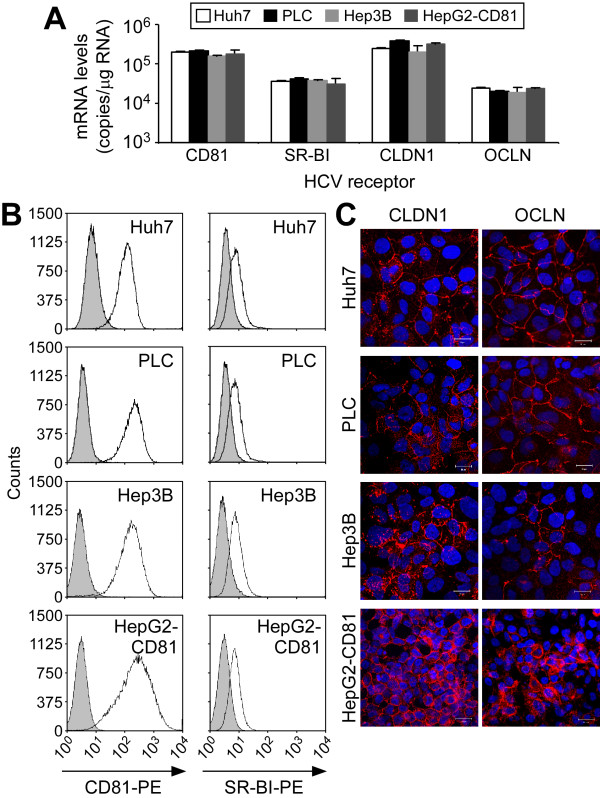
Figure 2.
Expression of HCV entry factors in hepatoma cells lines. (A) Total RNA was extracted from Huh7, PLC, Hep3B and HepG2-CD81 cells and mRNA copies were determined by RTqPCR using standard curves comprised of DNA plasmids expressing the coding sequence of the gene of interest. Absolute quantities were normalized to GAPDH and data are displayed as mRNA copies/μg total cellular RNA (means ± SD). (B-C) Cell surface expression of HCV entry factors on Huh7, PLC, Hep3B and HepG2-CD81 cells was determined by flow cytometric analysis or IF. (B) For flow cytometric analysis, cells were trypsinized and stained with mouse anti-CD81 or anti-SR-BI monoclonal antibodies and an anti-mouse secondary antibody conjugated with PE. Shaded regions represent cells stained with a monoclonal mouse IgG control primary antibody and an anti-mouse PE-conjugated secondary antibody. (C) For IF analysis, fixed cells were stained with antibodies specific for CLDN1 or OCLN and counterstained with a species specific Alexa-555-conjugated secondary antibody. Indicated protein is red (Alexa 555) and nuclei are blue (Hoechst). Magnification × 630; scale bar = 20 μm.

