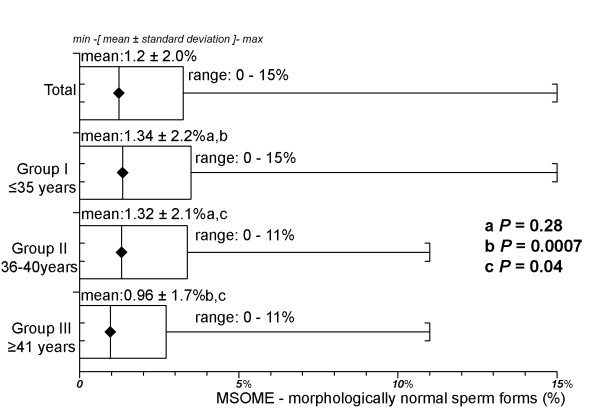
Figure 2.
Percentage of morphologically normal sperm forms by MSOME according to age for the three age groups. There was no difference in the percentages of normal sperm in the two younger (I and II) groups (P = 0.28, Mann-Whitney U test). The percentage of normal sperm in the older group (III) was significantly lower than those in the younger (I and II) groups (P = 0.0007 and P = 0.04, Mann-Whitney U test).

