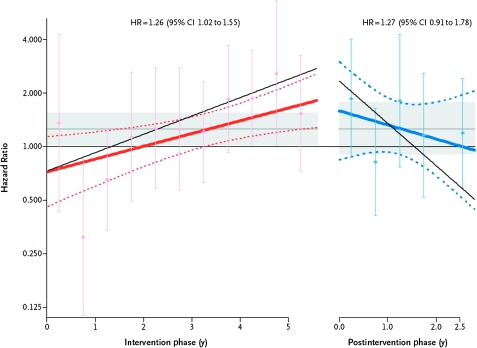
Figure 2.
Breast cancer risk during intervention and after intervention in the Women's Health Initiative Estrogen Plus Progestin Trial. Depicted are time-varying linear hazard ratios (solid red and blue lines) and 95% confidence intervals (95% CIs) (dashed lines) for the effect of estrogen plus progestin vs placebo on breast cancer incidence during the intervention (left) and post-intervention (right) phases of the Women's Health Initiative randomized clinical trial. Circles and error bars represent hazard ratios of breast cancer and 95% CIs, respectively, for analyses based on events during each 6-month period. Results for a sensitivity analyses, with events censored 6 months after participants became nonadherent (defined as using <80% of study pills or starting non-protocol hormone therapy) are depicted by the slanting thin black solid lines in the intervention and post-intervention phases. The shaded areas indicate the overall mean and 95% CIs for the hazard ratios in the intervention and post-intervention phases. Modified from and reproduced with permissions from New England Journal of Medicine (34).

