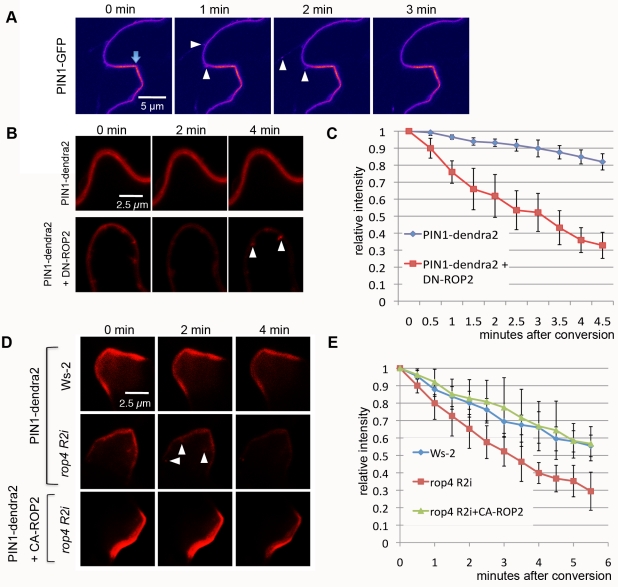
Figure 1. PIN1 endocytosis is inhibited in the lobe region by the ROP2 pathway in PCs.
(A) Time-lapse imaging of PIN1-GFP transiently expressed in tobacco PCs. PIN1-GFP signal was imaged using laser scanning confocal microscopy 3 d after the infiltration of tobacco leaves with agrobacterium containing pPIN1-PIN1-GFP. Internalization of PIN1-GFP from the PM (arrowheads) occurred preferentially in the indention region but not in the lobe region (arrow) where stronger PM accumulation of PIN1-GFP was observed. Note that only a cell at the left side of the image expressed PIN1-GFP, and internalization events were only visualized in that cell but not in the cell at the right side of the images. (B) A time-course analysis of PIN1-dendra2 internalization after photo-conversion in tobacco PCs. Signal in the red color represents photo-converted PIN1-dendra2. PIN1-dendra2 was transiently expressed in tobacco PCs for 3 d before photo-conversion was achieved. Coexpression of DN-ROP2 promoted vesicle formation (arrowheads) from the PM and accelerated decrease of PM signal. (C) Quantitative analysis of the PM signal representing photo-converted PIN1-dendra2 shown in (B). Relative intensity was measured as absolute value of intensity divided by value of intensity in the first time point. Error bars represent standard deviation (SD) (n = 5). (D) A time-course analysis of PIN1-dendra2 internalization after photo-conversion in Arabidopsis PCs. PIN1-dendra2 (and CA-ROP2) was transiently expressed in WT or rop4 R2i Arabidopsis PCs for 24 h. Formation of vesicles (arrowheads) and decrease of PM signal were accelerated in rop4 R2i cells. Coexpressing CA-ROP2 suppressed both vesicle formation and decrease of PM signal in rop4 R2i cells (n = 5). (E) Quantitative analysis of PM signal shown in (D). Measurements of signal were done as in (C).

