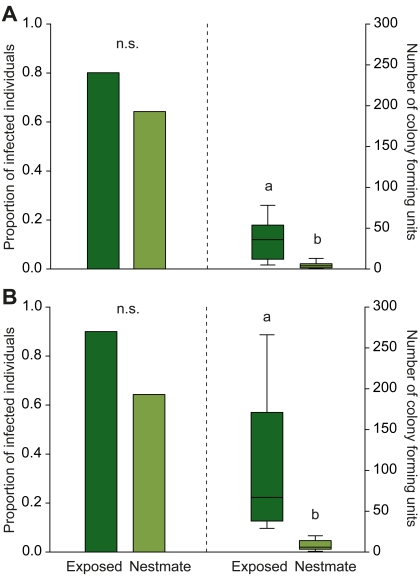
Figure 3. Fungal infection levels of treated individuals and their nestmates.
Proportion of exposed individuals (dark green) and nestmates (light green) that show fungal growth inside their bodies (left panels) and number of fungal colony forming units in infected ants (right panels), after (A) 3 d and (B) 5 d of social contact. On both days, the proportion of infected individuals was equally high between directly fungus-exposed ants and their nestmates, indicating a high frequency of pathogen transfer between group members. Yet the infection load of infected nestmates was significantly lower on both days (approximately 8 times lower on day 3 and 12 times lower on day 5). Bars give the proportion of infected individuals in the different groups (n = 10 for directly exposed and n = 14 for nestmates per day) and boxplots show median and 25%–75% quartiles of CFUs in infected individuals (day 3: n = 8 directly exposed individuals and n = 9 nestmates; day 5: n = 9 each for directly exposed and nestmate ants). Different letters indicate statistically significant differences at α = 0.05.

