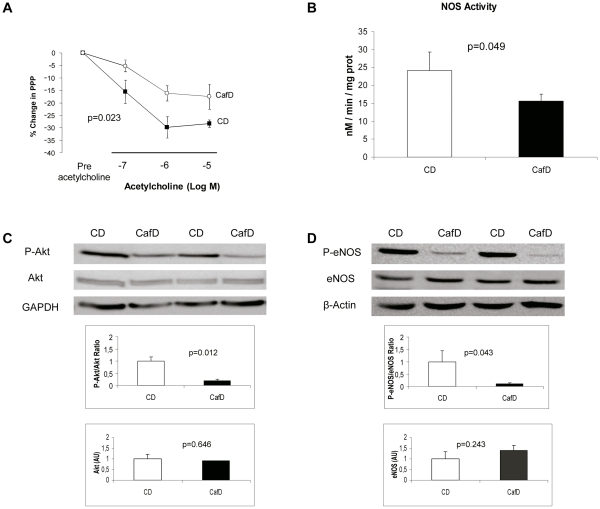
Figure 4. CafD rats show liver endothelial dysfunction.
A) Response to ACh in livers from control diet rats (CD; black squares; n = 6) and high fat diet rats (CafD; white circles; n = 6). B) NOS activity in liver homogenates from control rats (CD; n = 4) and cafeteria fed-rats (CafD; n = 4). C) Representative blots and densitometry readings of liver P-Akt (at Ser473) to Akt ratio and D) P-eNOS (at Ser1176) to eNOS ratio (western blotting). AU: Arbitrary Units.

