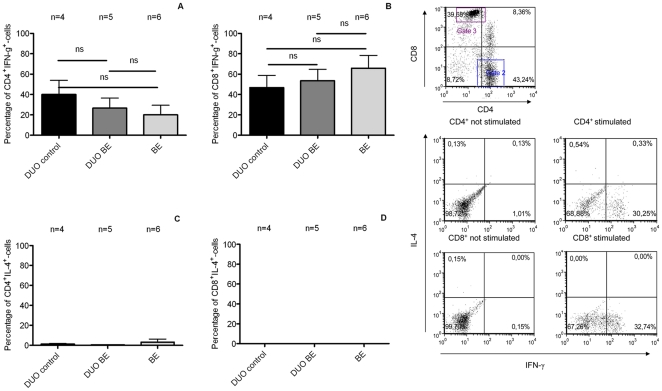
Figure 6. Absence of IL-4 positive lymphocytes in BE cultures determined by intracellular FACS-staining.
(1) Intracellular staining for IFN-γ and IL-4. Intracellular staining for IFN-γ and IL-4 in T-cells was determined after stimulation with PMA (20 ng/ml) and ionomycin (1 µM) for 6 hrs. Hereafter, CD4 + and CD8+ cells from ex-vivo cultures of BE and duodenum from BE (DUO BE) and duodenum from controls (DUO control) were analysed. Each bar represents mean value±SEM of the percentage of IFN-γ cells inside CD3 +CD4+-population (panel A), percentage of IFN-γ cells inside CD3+CD8+-population (panel B), percentage of IL-4 cells inside CD3+CD4+-population (panel C) and percentage of IL-4 cells inside CD3+CD8+-population (panel D) (black bar: DUO control, dark grey bar: DUO BE, light grey bar: BE) (ns not significant) (BE, n = 6,DUO BE, n = 5, DUO control, n = 4). (2) Representative flowcytometry plots for IFN-γ and IL-4 Representative flowcytometry plots of a representative staining of lymphocytes from a duodenal culture ex vivo. Gates for CD4 and CD8 were set and positive cells for IL-4 and IFN-γ were determined.

