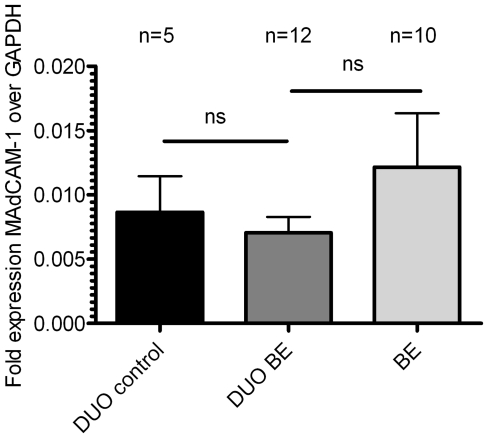
Figure 8. MAdCAM-1 mRNA expression is similar in BE and duodenal tissue from BE patients and controls.
Real-time quantitative polymerase chain reaction RNA assays were performed on total BE biopsies (BE, n = 12), duodenal biopsies from BE patients (DUO BE, n = 10) and duodenal biopsies from controls (DUO controls, n = 5) (black bar: DUO control, dark grey bar: DUO BE, light grey bar: BE). Expression of MAdCAM-1, corrected for GAPDH, 2−ΔCT±SEM, is represented on the y-axis (ns: not significant).

