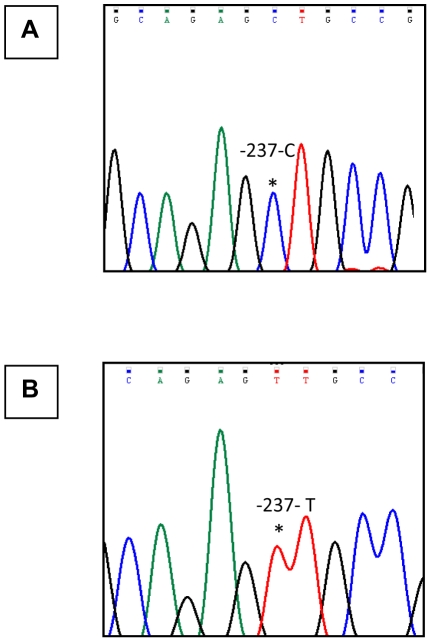
Figure 1. PCR amplification and sequencing analysis chromatograms for the −237C/T polymorphism.
Panel (A & B): Chromatogram showing the sequencing analysis of the 622 bp amplicon derived from individual with polymorphic C (shown in panel A), or T type alleles (shown in panel B) respectively. The presence of the wild type −237C and the polymorphic −237T allele has been indicated with (*).

