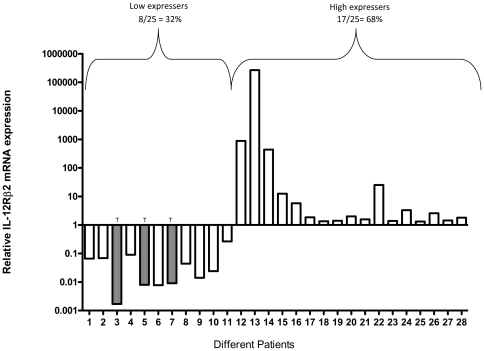
Figure 6. Relative mRNA quantification of IL-12Rβ2 mRNA expression in tuberculosis patients (N = 28).
Histogram shows the IL-12Rβ2 mRNA expression profile in the blood of the tuberculosis patients. The identification of the polymorphism at −237 site has been carried out by PCR amplification and sequencing (forward & reverse) of the 622 bp region spanning −780 to −159. The patients with the T at −237 polymorphic site has been indicated. The bars represent expression of IL-12Rβ2 mRNA in each individual. The fold activity pattern in real time PCR assay was calculated as described in methods, [15]. The individuals with reduced / elevated IL-12Rβ2 mRNA expression have been designated as Low expressers / High expressers.

