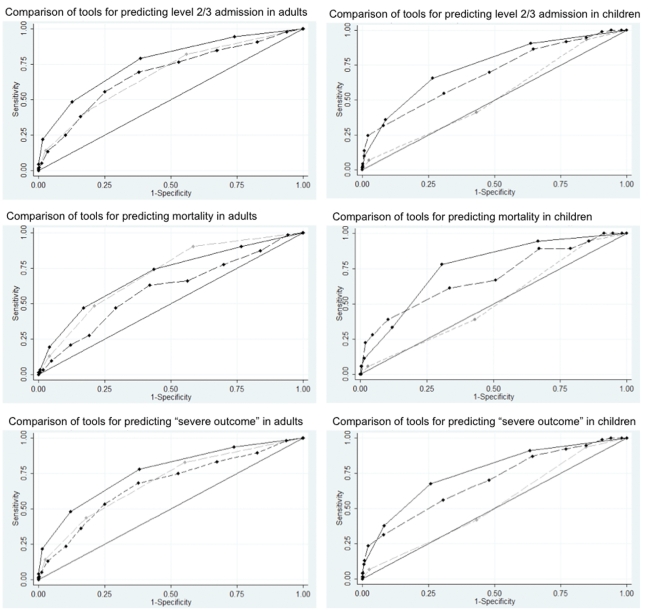
Figure 1. The predictive values of CATs, CURB-65 and PMEWS for predicting severe outcomes in adults and children with pandemic influenza.
ROC curves comparing the predictive value of CATs (black solid line), CURB-65 (grey dash line) and PMEWS (black dash line) in relation to Level 2/3 admissions (upper panels), mortality (middle panels) and combined severe outcomes (lower panels) in adults (left panels, age ≥16 years, n = 1040) and children (right panels, age<16 years, n = 480).

