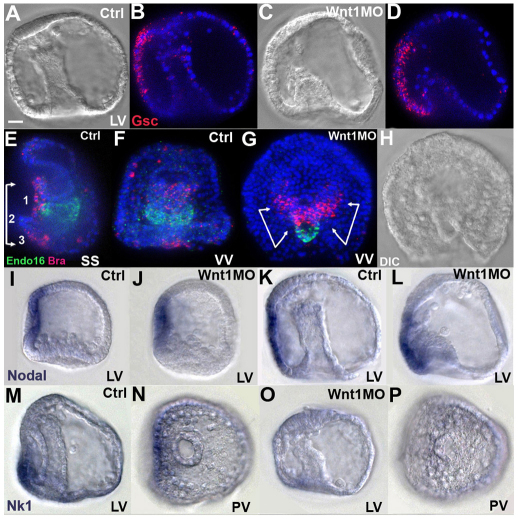
Fig. 3.
Posterior-ventral cell fate changes in Wnt1 morphants during gastrulation. (A-D) FISH detecting gsc mRNA (B,D; red) in a 36-hour control sea urchin embryo (A,B) and a Wnt1 morphant (C,D). Blue, DAPI. (E-H) Two-color FISH detecting bra (red) and endo16 (green) expression in a control 3-day larva (E,F) and Wnt1 morphant (G,H). Blue, DAPI. (I-L) Chromogenic ISH detecting nodal mRNA in controls (I,K) and Wnt1 morphants (J,L) at mesenchyme blastula (I,J, 28-hour) and gastrula (K,L, 36-hour) stages. (M-P) Chromogenic ISH detecting nk1 mRNA in controls (M,N) and Wnt1 morphants (O,P). LV, lateral view; PV, posterior view; SS, sagittal section; VV, ventral view. Scale bar: 20 μm.

