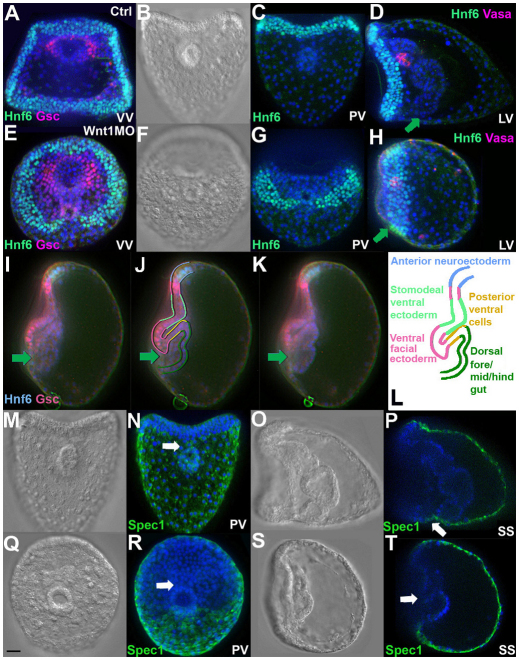
Fig. 5.
Ectoderm marker expression reveals shifts in the positions of oral, aboral and ciliary band territories. (A-K) Nuclei in CB cells are labeled with anti-Hnf6 (green) and in A,E,I-K those in the oral ectoderm are immunostained for Gsc (magenta); all nuclei are labeled with DAPI (blue); D,H are labeled with Vasa antibody (magenta). (A-D) Control embryos; (E-K) Wnt1 morphants. DIC (B,F) and immunostained (C,G) images show that the posterior transverse CB segment is ventral to the blastopore in control embryos and dorsal in morphants. In B,C,F,G, ventral is at the top. In D,H-K, ventral is to the left. Green arrows in D,H-K mark the position of the blastopore. (I-K) Sagittal focal planes reveal that the folded oral epithelium is connected to invaginated tissue in a continuous sheet, as illustrated in L. (M-T) Control embryos (M-P) and Wnt1 morphants (Q-T) immunostained for Spec1 (green). White arrows in N and P point to Spec1 staining in the supra-anal ectoderm on the ventral side of the blastopore in controls; white arrows in R and T mark the ventral side of the blastopore in morphants, showing that the boundary of Spec1 expression shifts to the dorsal side of the blastopore. VV, ventral view; PV, posterior view; LV, lateral view; SS, sagittal section. Scale bar: 20 μm.

