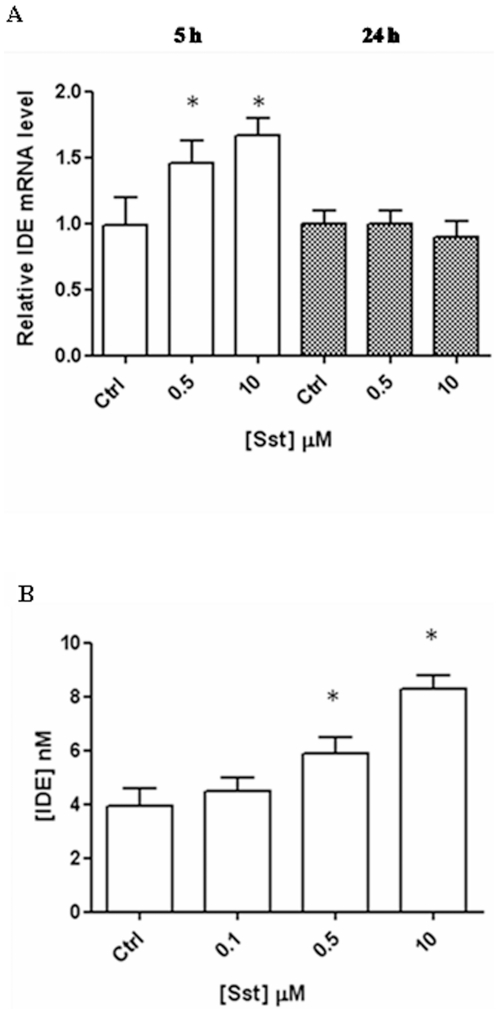
Figure 2. Somatostatin modulation on IDE level in BV-2 cells.
(A) IDE mRNA increases after 5 hrs of incubation with somatostatin (white columns); 24 hrs after incubation, the level is similar to the control (grey columns). Basal mRNA levels were measured by real time PCR in individual preparations of BV2. Data were first normalized against GAPDH and then expressed setting the value measured in controls at 1. The results presented are the means ± ES (B) Elisa analysis of conditioned medium indicates that IDE level increases in BV-2 cells after 24 hrs of incubation as a function of somatostatin concentration. The results presented are the means ± SEs of five independent experiments in triplicate. P<0.05, one-way ANOVA, followed by Tukey's test, n = 15.

