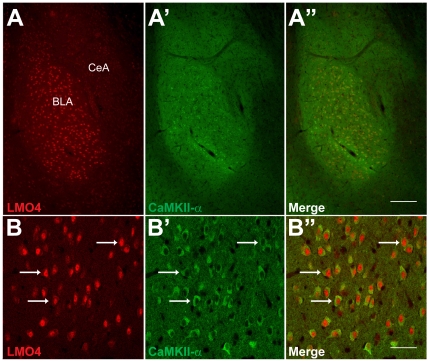
Figure 1. Co-localization of LMO4 and CaMKII- α in the BLC.
Top panels: Dual-channel immunofluorescence images show high levels of expression for both LMO4 (A) and CaMKII-α (A′) in the BLC. Scale bar: 200 µm. Bottom panels: strong co-localization of both markers is evident in numerous BLC neurons (arrows, B, B′, and B″), with the LMO4-postive nuclei and CaMKII-α-positive perikarya. Scale bar: 50 µm.

