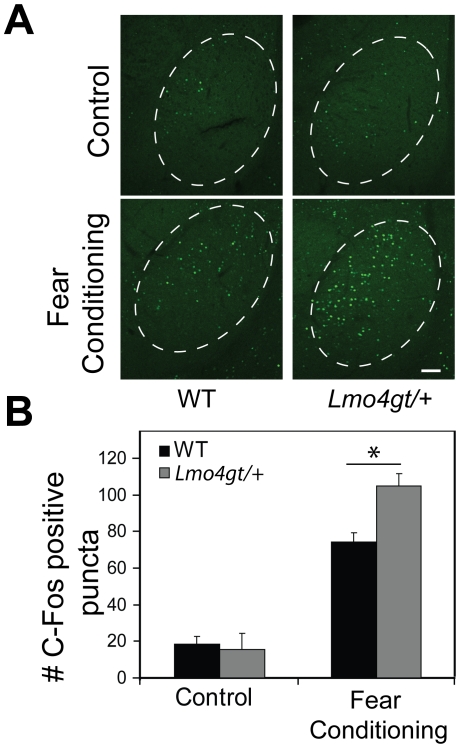
Figure 5. Lmo4gt/+ mice display increased neuronal activation after FC.
Neuronal activation in the BLC was assessed 2 hours after FC in both WT and Lmo4gt/+ mice by measuring c-Fos positive puncta in the BLC. Control mice were exposed to the FC chambers but not subjected to tone/shock pairings. A) Genotypic differences in c-Fos staining were not observed in the BLC under control conditions. After FC, Lmo4gt/+ mice displayed significantly more c-Fos positive puncta than their WT counterparts. Scale bar: 200 µm. B) Quantification of results in panel A. Data are presented as mean ± SEM. *, p<0.05. n = 3–5/group.

