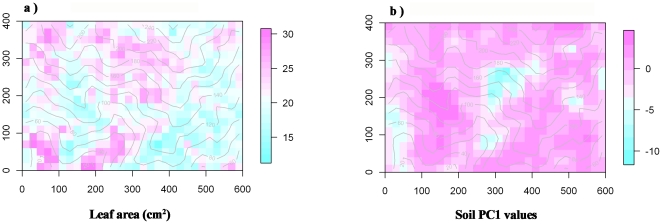
Figure 2. Maps of the quadrat trait and soil fertility patterns.
a) The observed leaf area pattern for the GTS plot. b) The soil PC1 values pattern for the GTS plot. The color scale on the right of each map indicates the trait and soil PC1 values. The lines are elevation contour lines at 10-m intervals. See Figure S3 for the complete maps of other traits and the soil PC2 values for GTS plot and Figure S4 for maps of all traits and the soil PC1 and PC2 values for BCI plot.

