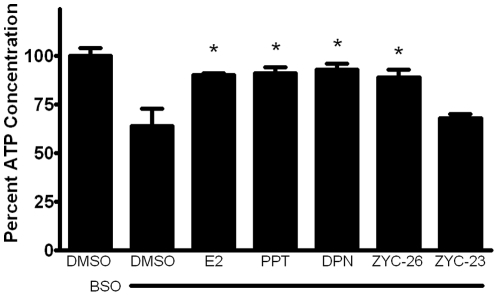
Figure 7. Effects of E2, PPT, DPN, ZYC-26 and ZYC-23 on the intracellular ATP concentration inside of BSO-treated FRDA fibroblasts.
All steroid concentrations were 100 nM, DMSO concentration was 0.1% and BSO concentration was 1 mM. Depicted are mean ± SD for n = 8 per group. * indicated p<0.05 versus BSO alone-treated cells. 100% normalized ATP control concentration = 501 pM.

