
Figure 2.
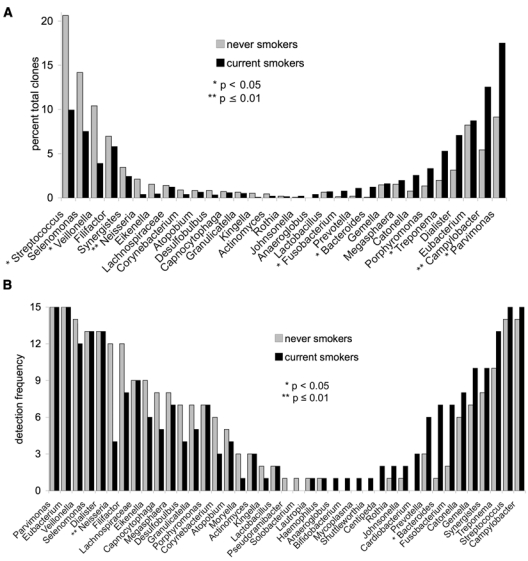
Distribution of 3157 clones by genus in 15 current and 15 never-smokers. Levels of genera are shown in (A) and detection frequency in (B). Genera predominant in never-smokers are arranged on the left, and those predominant in current smokers are arranged on the right. Significant differences in abundance (p < 0.05, two-sample t test on transformed variable) and prevalence (p < 0.05, Fisher’s exact test) of certain genera were observed between the two groups (AYS, HNN, PSK).