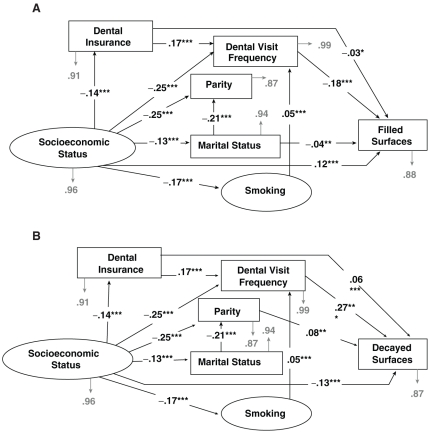
Figure 2.
Path diagrams, parity, and dental caries, Black and White US women ages 18-64 yrs, NHANES III. (A) Path model for filled surfaces. Model controlled for: race, age, and time since last live birth; *p ≤ 0.05, **p ≤ 0.01, ***p ≤ 0.001. (B) Path model for decayed surfaces. Model controlled for: race, age, and time since last live birth; **p ≤ 0.01, ***p ≤ 0.001.

