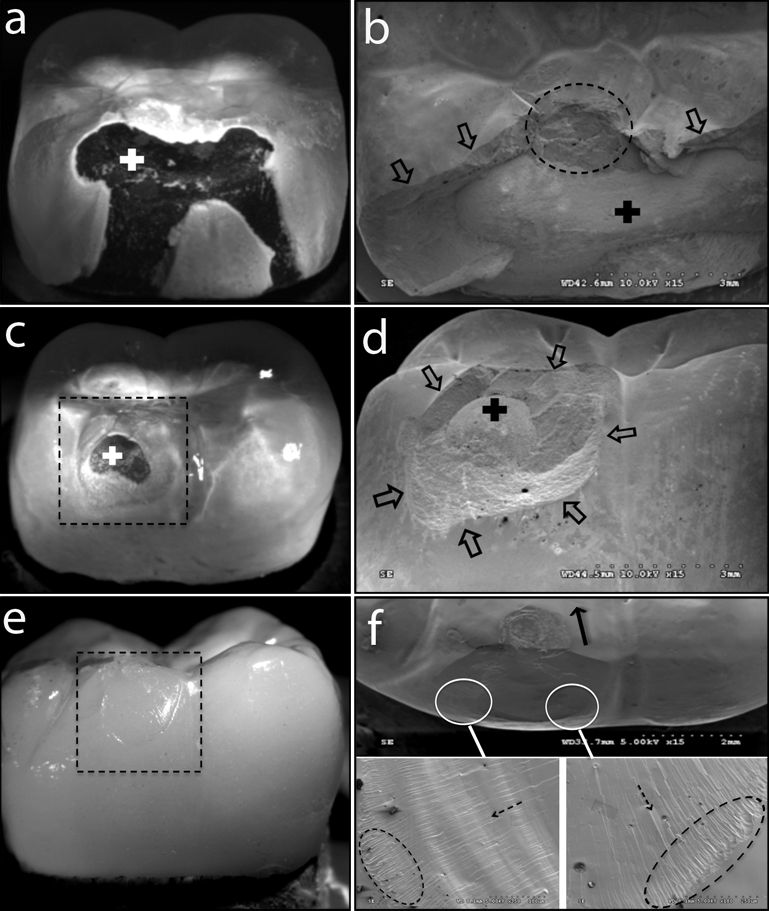
Figure 2.

A series of light-polarized (LP) and SEM images after sliding fatigue testing. Images (a) and (b) are LP and SEM of a sizable fracture of 1 MCR crown after 200,023 cycles at 1300 N of load (mild profile). White (a) and black (b) crosses lie on the exposed PdAg core after the fracture event. Oval segmented black line shows the damage created at the indentation contact area, and arrows delimit the fracture extension. (c) is a representative smaller chip fracture of an MCR crown (dotted box), exposing the PdAg core (white cross). (d) shows the SEM image of the dotted box presented in (c), showing the fracture extension after 95,034 cycles at 1220 N load. Black cross in (d) lies on the core exposed after fracture. Images (e) and (f) are LP and SEM images of a representative fatigue-failed specimen of CER after 49,500 cycles at 300 N Load. (f) shows an occlusal SEM view of the indentation area and the arrow indicating the sliding direction toward central fossa. Right and left bottom images in (f) are magnifications of marginal areas (white circles) of porcelain cohesive fracture. Hackle lines (dotted arrows) and a series of twist hackles (oval dotted lines) indicate fracture propagation from indentation contact toward the margins. Note that the Y-TZP core was not exposed.
