Figure 2.

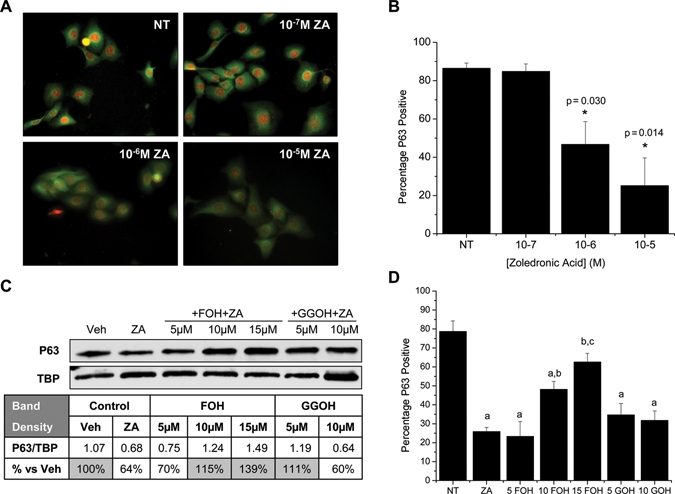
Zoledronic acid inhibits p63 in clonal oral keratinocytes. (A) Immunocytochemistry depicting p63 nuclear stain (red) and B-tubulin cytoplasmic stain (green). (B) Percentage p63-positive cells as calculated by applying a common threshold to matched p63-stained images and comparison with total number of cells per field. Results are reported as the average of 3 independent experiments (N = 3), with 3 random fields analyzed per treatment regimen per experiment. (C) Representative Western blot of nuclear extracts from NOK-SI treated with 10-5 M ZA, vehicle control, FOH, or GGOH. Band densitometry was used to normalize p63 to the TATA binding protein (TBP) loading standard. (D) Percentage p63-positive cells calculated as in (B) after treatment with vehicle (NT), 10-5 M ZA, ZA+5-15 µM FOH, or ZA+5-10 µM GGOH. (a) Significantly less than NT control; (b) significantly higher than the ZA group; (c) significantly higher than the 10 FOH group. Results are reported as mean ± standard deviation.
