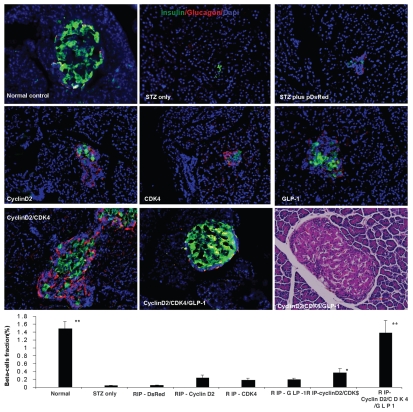
Figure 1.
Triple staining for pancreas tissue at magnification of 200x. Anti-insulin (green), Anti-glucagon (red), and anti-nuclear (blue) antibodies were used. Upper left: normal pancreatic islet; Upper middle: STZ treated; Upper right: STZ plus RIP-DsRed; Middle left: RIP-cyclin D2 treated; Middle center: RIP-CDK4 treated; Middle right: RIP-GLP1 treated; Lower left: RIP-cyclin D2/CDK4 treated; Lower center: RIP-cyclin D2/CDK4/GLP1 treated; Lower right: H&E staining for similar slide of RIP-cyclin D2/CDK4/GLP1. Figure at the bottom is the β cell fraction, *p < 0.05; **p < 0.001 vs. STZ control; n = 6 animals, Error bars represent mean ± SEM, N values are numbers of pancreas analyzed for each group, all animals killed at 4 weeks after UTMD.

