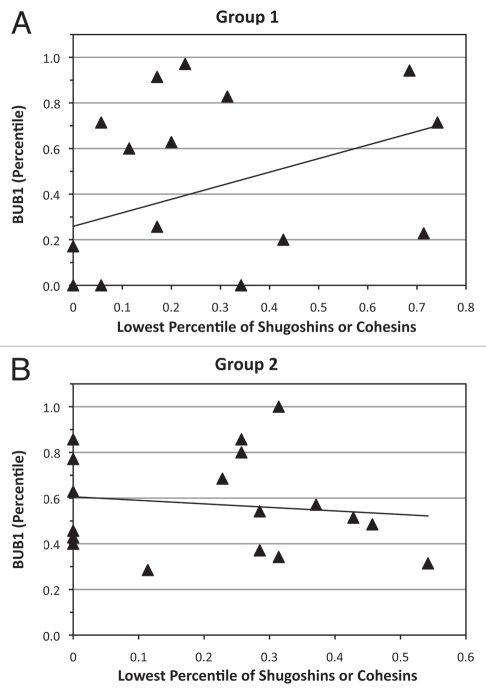
Figure 3.
Correlation curves for BUB1 compared with minimal expression of shugoshins or mitotic cohesins (STAG1, SMC1A, SMC3, RAD21, SGOL1 and SGOL2). (A) significant positive correlation (rho = 0.60, p < 0.01) within group 1 oocytes. (B) Absence of a significant correlation (rho = -0.20, p = 0.43) in group 2 oocytes.

