
Table 2.
Significant Correlation Coefficients between transcript expression levels in group 1 and group 2 oocytes
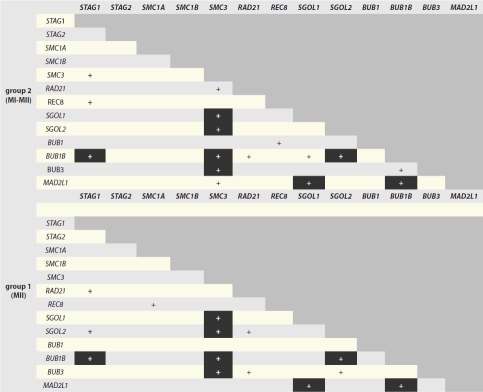 |
Highlighted correlations are conserved between groups.
Official websites use .gov
A
.gov website belongs to an official
government organization in the United States.
Secure .gov websites use HTTPS
A lock (
) or https:// means you've safely
connected to the .gov website. Share sensitive
information only on official, secure websites.
Significant Correlation Coefficients between transcript expression levels in group 1 and group 2 oocytes
|
Highlighted correlations are conserved between groups.