
Figure 6.
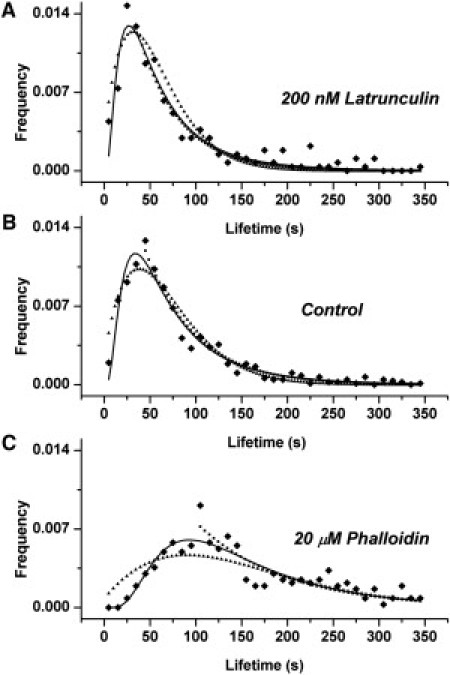
Fitting the data with the resulting distributions. The figure shows fitting of experimental data with Eq. 3 (solid line), Eq. 5 (dotted line), and Eq. 7 (triangles) for the treatment with 200 nM Latrunculin (A), control cells (B), and 20 μM Phalloidin (C). The fitting parameters for each equation are given in Table 1.