
Figure 5.
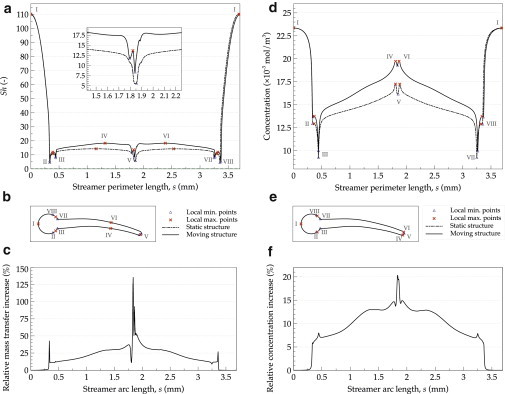
Distributions of local mass transfer (represented by Sh) and concentrations over the whole biofilm-liquid boundary and their relative increase in oscillatory conditions in respect to the static case. Values for the static case (dashed lines) are compared along the biofilm outer perimeter, s, with those obtained in moving conditions: (a and d) Local Sherwood number, Sh, and concentration; (b and e) places on the biofilm-liquid boundary where the local Sh maxima and minima occurred and the corresponding locations for concentration extremes; (c) relative increase in the local mass transfer; (f) relative increase in the concentration at the biofilm surface.