
Figure 3.
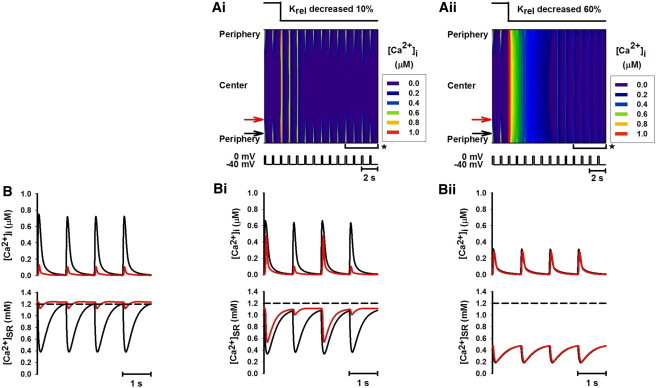
Effect of increasing the sensitivity of RyRs by decreasing Krel by 10% and 60%. (A i and A ii) Line-scan images of spatial patterns of [Ca2+]i transients produced by decreasing Krel by 10% and 60%, respectively. (B, B i, and B ii) Traces of [Ca2+]i transients (upper) and Ca2+ concentration in the SR space (lower) recorded from peripheral (black; see online color figure) and central (red; see online color figure) regions of the cell before (B) and after (B i and B ii) increasing the sensitivity of RyRs. B i and B ii are the time traces recorded during the time period marked by the horizontal brackets with asterisks shown in A i and A ii.