
Figure 4.
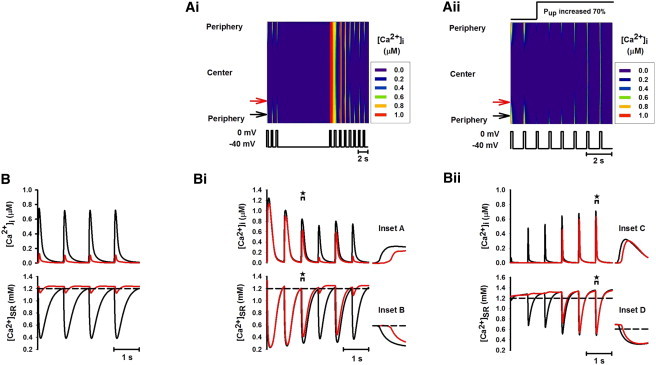
Effects of elevated SR Ca2+ content on Ca2+-wave propagation by pausing pacing for 10 s when [Ca2+]o was increased from 1 mM to 10 mM and by increasing SR uptake rate Pup by 70%. (A i and A ii) Line-scan images of spatial patterns of [Ca2+]i transients produced by pausing voltage-clamp pulse and increasing Pup, respectively. (B, B i, and B ii) Traces of [Ca2+]i (upper) and [Ca2+]SR (lower) recorded from peripheral (black; see online color figure) and central (red; see online color figure) regions of the cell before (B) and after (B i and B ii) elevating the SR Ca2+ content. (Insets A–D) Expanded plots of the time traces for the time periods marked by the brackets with asterisks shown in B i and B ii.