
Figure 5.
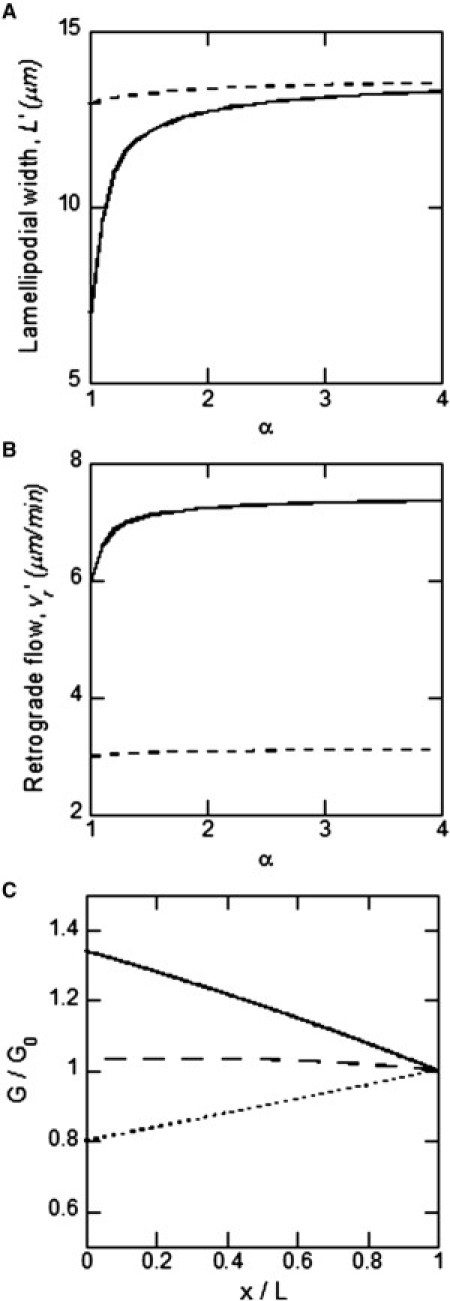
Model prediction for G-actin increase. (A) P-domain width as a function of G-actin increase factor α for control conditions (solid line) and for blebbistatin-treated growth cones (dashed line), based on expressions derived in the Supporting Material. (B) Retrograde flow rate versus α for the same conditions as in A. (C) G-actin spatial profiles (normalized by G0) predicted by Eq. 11 for = 0 μm/s (dotted line), 0.15 μm/s (dashed line), 0.3 μm/s (solid line). We used parameters L, γ, and vr measured in Van Goor et al. (26), D = 5 μm2/s (54), and the ratio = 2 (55).